When it comes to understanding fundamentals of database systems, there may be better no better person to speak with than Dr. Michael Stonebraker, who, along with Eugene Wong in 1974, created the first working relational database system, INGRES. Even more remarkable, he has kept pace with the database system development in the 40 years since.
At the University of California at Berkeley, he soon went on to expand on the work on INGRES for an object-relational database management system, Postgres. Later, at Massachusetts Institute of Technology, he co-architected the Aurora/Borealis stream processing engine, the C-Store column-oriented DBMS, the H-Store transaction processing engine, which became VoltDB, the SciDB array database management system, and the Data Tamer data curation system. Presently he serves as an advisor to VoltDB and chief technology officer of Paradigm4 and Tamr.
Currently, he is an Adjunct Professor of Computer Science at MIT, where he is co-director of the Intel Science and Technology Center focused on big data.
In 2014, the Association for Computing Machinery bestowed Stonebraker with The Turing Award, ACM‘s most prestigious technical award, is given for major contributions of lasting importance to computing. The organization is now commissioning books about each of its award winners, starting with Stonebraker. “Making Databases Work: The Pragmatic Wisdom of Michael Stonebraker,” published in January ($119.95 hardback/$99.95 paperback/$79.96 e-book or free for ACM members), is a compilation of essays from both Stonebraker and others in the field, covering both his work and how it has changed computing.
We spoke with Stonebraker about what factors drove the evolution of database management systems in the past decades and where he sees data management technology developing in the years to come…
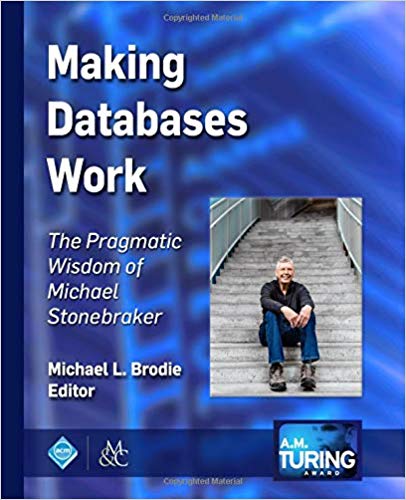 What does it feel like to have a book published about your life’s work?
The book was commissioned by ACM, and it’s designed to reflect on why I won the Turing Award. And so, as I won in 2014, my book is actually the first one to come out in what will be a series of books about each Turing Award winner. So, anyway, I like the approach; it takes a look at my work from all angles. The book was edited by a colleague, Michael Brodie, and he solicited input from lots and lots of people. So you are getting lots of perspectives.
Just overall, back in the 1970s or even 1980s, did you realize that data would be as important as it’s turning out to be now?
Ah, no. I mean, the simple answer is that in the 1970s, there was only one database market, basically business data processing. And the whole goal of data management was to make business databases work better. Relational databases were originally designed with that goal in mind, and that was the only market anyone really saw until around 1990. Then I think over the next 15 years, it occurred to most everybody that they needed a database system.
So the ubiquity of the need for data management has come in the last 10 or 15 years.
Excellent, excellent. And you stated many times that one size does not fit all.
That’s absolutely correct. I think when you hear the word big data, what that really means is that essentially everybody has a big data problem. Whether it’s the scientists who are recording petabytes of experimental data, whether it’s the social media people who are trying to figure out the inflections of people’s social media remarks, whether it’s the English folks who are counting commas or sentence structure, I think essentially everybody has a big data problem.
Business data processing is pretty much happy with relational databases, but for the entirety of everybody, one size does not fit all. And so, there have been, I would say in the last 20 years, a veritable explosion of alternative data management solutions.
Prior to this interview, I did not know you and Eugene Wong had created the first relational database, the first working model.
That’s, well, this was in the early to mid-70s. Ted Codd wrote his pioneering paper in 1970 that said you should view data management as tables, the simplest possible data structure, and then access them in a high-level language. Now that means SQL. These were revolutionary thoughts at the time and went counter to all the existing data management systems.
Immediately, there was a huge debate between the relational folks who said Ted Codd’s ideas looked great, and the traditionalists who said you can’t possibly build one of these to be efficient– and even if you could, no one could understand these newfangled languages.
It was an obvious thing to do, to build a relational database system. And in the early to mid-70s, there were two main prototypes that were built. One was INGRES, which Eugene Wong and I built at Berkeley. And the other one was a system called System R that was built at IBM Research. And those were the two full function, working relational database systems in the 70s.
So INGRES and System R were absolutely engineered to do business data processing. And what happened was, in the research community in the early 80s, people said wow, this relational stuff looks terrific. I’m gonna try applying it to computer-aided design or library card catalogs, or dot, dot, dot.
And to the first approximation, relational databases fell on their face when you tried to apply them in different areas. The problem wasn’t the relational model, it was more the data types that INGRES and System R supported were floats, integers, character strings, money, and that’s what the business people wanted. But if you want to build a geographic information system, you want points, lines, polygons, that sort of stuff.
So one of the basic ideas in Postgres was let the user have whatever basic data types he wants to manage, and don’t predefine them by insisting they be the ones that apply to business data processing.
“Looking back, it is still hard to fathom how a graduate student whose thesis explored the mathematics of random Markov chains and who had no experience building software artifacts and limited programming ability (actually none, I believe) was going to end up helping to launch an entire new area of CS research as well as a $50B/year industry.” — David J. Dewitt, “Making Databases Work”
So the whole idea was to expand the reach of relational systems and Postgres did exactly that. And that was one of the major advances during the 1980s.
In the 1990s, retail got the good idea to record everything that goes under any checkout wand in every store in a chain, and keep these historical records in what’s now come to be called a data warehouse.
Buyers interacted with this data warehouse to find out, for example, that pet rocks are out and Barbie dolls are in. So you can use that information to rotate stock, you know, bring the pet rocks up front and discount them, tie up Mattel with a big order for Barbie dolls so your competitors can’t get any. So basically stock rotation.
Better stock rotation paid for the cost of these historical data warehouses within six months. But the thing was, the access patterns were quite different, and you didn’t want to organize the data the same way as people used to do it.
You also were instrumental in creating Vertica…
So what happened was I started working on the academic precursor to Vertica, which was called C-Store. You could think of a table as a bunch of rows and columns, and what all database systems had done up until that time was store the data row by row by row on storage. And it turns out data warehouse queries go wildly faster if you organize the data column by column by column — in other words, rotate your thinking 90 degrees.
All data warehouse products over time have morphed to what’s called a column store. They still run SQL just like before; it’s just the storage organization is a great deal different.
And so Vertica is a good example, even within the relational model, of how one size doesn’t fit all. Some problems are better attacked by row stores, some of them better by column stores.
I just listened to a recent lecture that you had, where you had mentioned that data analysts will eventually be superseded by data scientists and a new wave of data-driven analysis?
So data warehouses are oriented toward records of historical customer-facing data. And warehouses are accessed by business intelligence people who are trying to do better stock rotation or to better understand their customer, or whatever. And that’s very, very different than what data scientists want to do.
There is a burgeoning community of users of database systems that call themselves data scientists. My favorite example of a data science application was a business pitch from a startup I listened to three or four years ago. They were working with one of the big hotels in Las Vegas. The hotel wants to maximize room revenue per night. And that’s obviously what every hotel wants to do. And you can lower your prices and fill up the rooms, or you can charge high prices and have a lot of empty rooms, or you can have dynamic pricing whereby how much you charge people varies by how long in advance it is, how full you are, and all that kind of stuff.
So the standard wisdom if you’re a data scientist is to say: Why I don’t I collect a lot of historical data and why don’t I collect a lot of other features, like how many visitors are in Las Vegas right now, what the weather is like, etc., etc.
“In 2009, Mike famously criticized MapReduce to the chagrin of the Big Data community, only to be vindicated five years later when its creators disclosed that Mike’s criticism coincided with their abandonment of MapReduce and Hadoop for yet another round of Big Data managementsolutions of their own making.” — Michael Brodie, “Making Databases Work”
So you have a lot of features, for example, the weather, the average temperature over history. And historical hotel occupancy. You get a lot of features and you have as much history as you can get your hands on. Then you want to fit a predictive model to these features. The predictive model wants to predict either hotel occupancy or the price you want to charge, based on all these various features. So if you can fit a model, then look at the model output, and you set your prices according to what this predictive model suggests.
So this is one kind of thing a data scientist does. And this is just a very, very, different kind of activity than done in data warehouses or online transaction processing.
Suppose I have a data warehouse that will say what’s selling right now. And there are a whole collection of business intelligence tools that allow you to look up more historical data and slice it and dice it whatever way you want, and get some business insight. So those folks are called business analysts. But if you take exactly the same data and you hand it to a data scientist, he’ll say, I’ll build you a predictive model that is going to predict what’s gonna sell, and then you can do the right thing.
With a business intelligence person, you get a big table of numbers; with a data scientist, you get a predictive model.
So which would you rather have if you are the CEO of this company? You would rather have the predictive model. So what’s gonna happen over the next decade or two is that data scientists are going to replace business analysts as people examining retail data. In addition, data scientists are gonna do all this other stuff. So it’s both going to be a bigger market, and it’s going to render obsolete the current business analysts.
For one of your newer projects, you are involved with a company that is doing machine learning to do data prep and data cleansing, right?
Okay, well, let me give you a quick example. Do you know what a procurement system is?
Oh yes, yes, very much so, yeah.
Okay, so if you work for a company and you want to buy some paper clips, you go to your procurement system. You type in a bunch of stuff about who to charge it to, and the procurement system spits out a purchase order. You take it down to Staples and they give you your paper clips.
Okay, so the obvious correct number of procurement systems for any company to have is one. Okay?
Yes, logically, yeah.
So GE has 75.
And the CFO of GE made the following observation. If you are one of these 75 purchasing officers, when your contract with Staples comes up for renewal, if you can figure out the terms and conditions that your 74 counterparts negotiated, and just demand “most favored nation status”, that’s worth 100 million dollars a year.
The reason for all these different procurement systems is GE is very divisional-ized or silo-ized. And if a given division buys lots of paper clips and gets a better price, then some other division.
And so it turns out, the $100 million is essentially all in the long tail and what you want is that you don’t buy many of them, find somebody else who buys more, and then demand their terms.
So every one of these 75 procurement systems has a supplier database. And to manage to save this $100 million a year, you have to integrate or unify these 75 independently constructed databases, with a total of something like 9 million suppliers.
And so, these were all independently constructed. There is no concept of a global key. No concept of a unique supplier ID. You know, you have to somehow piece together, with very imperfect data, who the same customers are. Because in your database, it might be Staples, Incorporated with an address in Gaithersburg. In my database, it’s just called Staples with an address in Boston.
And so, what the current company Tamr does, is it unifies at scale these disparate databases. Put differently, all enterprises silo-ized so they can get stuff done. So they divide into business units so that they can get agility.
But then after the fact, there’s a huge amount of upside to putting together data in these various silos. So that is what Tamr does, and it’s an AI machine learning system that pieces together the two representations of Staples that are in fact the same thing.
So it does data cleansing or master data management, but you don’t have to sit down or write down all the specific rules, this Staples equals that Staples….
Right, because the problem is master data management is a very mature field. You said exactly how the stuff works. You write a bunch of rules that say “this is the same as that.” And the trouble is, at scale that doesn’t work. And it’s well known that this does not work.
And so, just a quick for example. GE, I guess this is probably in some single year, has 20 million spend transactions. And they have a classification system for spend. You can spend on parts, you can spend on services. Parts can be computers, computers can be memory, so forth. So they have a classification hierarchy, and all they want to do is classify 20 million spend transactions into this hierarchy.
So they started writing rules, exactly the way master data management would suggest, and they wrote 500 rules. And with those 500 rules, they classified 2 million out of the 20 million transactions.
Alright, whew. So a very small percentage then, 10 percent.
And 500 rules is about as many as a human can get their noggin around. I have never seen a rule system with 5,000 rules because the technology just does not scale. Because humans cannot comprehend huge numbers of rules.
So traditional master data management just doesn’t work at scale. So what Tamr did was in fact, they took the 500 rules that GE wrote, used the 2 million such classified records as training data for a predictive model, and they fit a predictive model to the 20 million spend records and that classified 20 million records using 2 million as training data.
So machine learning will scale, rule systems will not scale, and so Tamr is a machine learning system and it’s architected that way solely because people want to solve big problems.
This sounds like a growth area for AI.
Another quick example is Toyota, the car company in Europe. So historically, Toyota has done distribution of cars by country. So a Spanish subsidiary, a French subsidiary, and so forth. So the problem is if you buy a Toyota in Spain and you move to France, Toyota develops amnesia. Because you’re a Spanish customer and the French guys have no clue who you are.
So Toyota is in the process of unifying 30 million European customers who are in 250 different datasets in 40 languages into a unified customer database so that they can do better customer service. And so another gigantic machine learning application.
This data unification or data integration or data cleansing, data preparation, it’s all the same stuff, which is put disparate datasets together. And what’s happening is that everybody but everybody has got this problem in spades.
Because everybody silo-izes to get stuff done. The interesting thing is that prior to machine learning, it was not cost-effective to do data integration at scale. With ML, you open up a whole new market of being able to do this stuff at scale.
I noticed in all these innovations that we discussed, over the past decades, the driver has always been finding a new way for organizations to make money or to save money, but in either case, you are approaching a very specific problem…
My point of view (and not everyone shares this view) is that you can say I am going to build a hammer and then I am going to go look to see if anybody’s got any nails. And so that’s innovation in search of somebody who wants it. My point of view is “that’s called theoretical research.” If no one wants what you’re building, then to me it’s not worth doing.
So I spend a lot of time talking to people with real problems. You know, finding out why they don’t like the current solution and then figuring out how to do it better. So it becomes customer driven rather than innovation driven.


